历史版本2 :JS实现粒子漩涡背景 返回文档
编辑时间:
内容长度:图片数:目录数:
修改原因:
1. 概述编辑
2. 示例编辑
2.1 报表设计
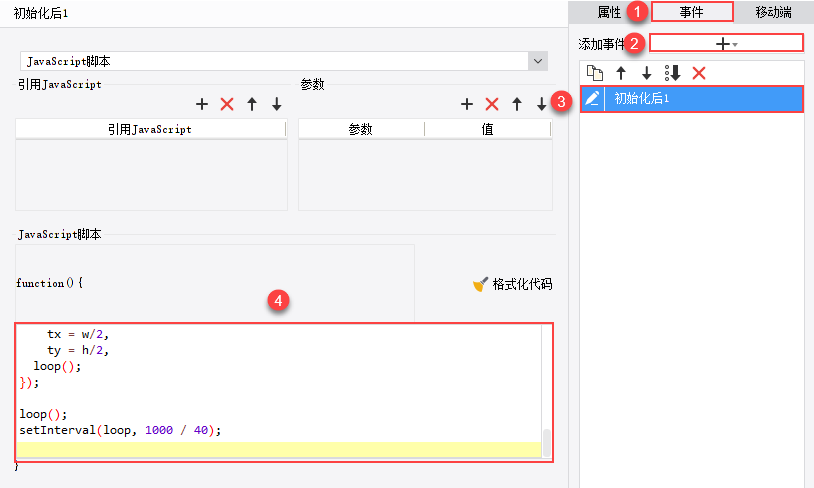
新建决策报表,选中 body 组件,添加初始化后事件,如下图所示:

JS 代码如下:
$("body").prepend('<canvas id="canvas" style="position:absolute;z-index:-2;"></canvas>');var canvas = document.getElementById("canvas");var ctx = canvas.getContext("2d");canvas.width = window.innerWidth;canvas.height = window.innerHeight;var w = canvas.width;var h = canvas.height;var part_count = 600;var P = [];var X, Y;var angle = 0.01;var centerX = w * 0.5, centerY = h * 0.5;var part = function(x,y,ix,iy,vx,vy,a,dist) { this.x = x; this.y = y; this.ix = ix; this.iy = iy; this.vx = vx; this.vy = vy; this.a = a; this.dist = dist;}function init(){ var x,y,ix,iy,vx,vy,a,dist; for(var i=0; i<part_count;i++){ ix = x; iy = y; vx = random(-1,1); vy = random(-1,1); rand = random(-80,100); dist = part_count/10+i; a = 1; P.push(new part(x,y,ix,iy,vx,vy,a,dist)); }}init();function bg(){ ctx.fillStyle = '#000000'; ctx.globalAlpha=0.25; ctx.fillRect(0,0,canvas.width,canvas.height,1);}function distance(dx,dy){ return Math.sqrt(dx * dx + dy * dy);}function draw(){ for(var i=0; i<P.length;i++){ var p = P[i]; p.a += 0.008; p.x = centerX + Math.cos(i+p.a) * (p.dist*i*0.1); p.y = centerY + Math.sin(i+p.a) * (p.dist); ctx.fillStyle = '#FFFFFF'; ctx.fillRect(p.x, p.y,2, 2); }}function loop(){ bg(); draw(); window.requestAnimationFrame(loop);}loop();function resize(){ canvas.width = window.innerWidth; canvas.height = window.innerHeight; centerX = window.innerWidth * 0.5; centerY = window.innerHeight * 0.5;}function random(min, max) { return Math.random() * (max - min) + min;}window.onresize = resize;
2.2 效果预览
保存报表,点击表单预览,效果如预期效果中所示。


