历史版本2 :ECharts图表实现堆积瀑布图 返回文档
编辑时间:
内容长度:图片数:目录数:
修改原因:
1. 概述编辑
1.1 版本
| 报表服务器版本 | 插件版本 |
|---|---|
| 11.0 | 1.0.5 |
1.2 应用场景
本文将使用 ECharts 图表引用模板数据集制作一个堆积瀑布图:
第一节点现在年初中间显示每月变化,最终节点显示合计值。
预期效果如下图所示:

1.3 安装插件
点击下载插件:ECharts图表集成
设计器插件安装方法请参见:设计器插件管理
服务器安装插件方法请参见:服务器插件管理
2. 示例编辑
2.1 准备数据
目前使用测试数据,仅展示数据结构,具体可以自己实现。
2.2 设计报表
2.2.1 插入图表
选中一片单元格区域,合并单元格后,再点击插入图表,选择「ECharts图表」。如下图所示:
2.2.2编辑代码
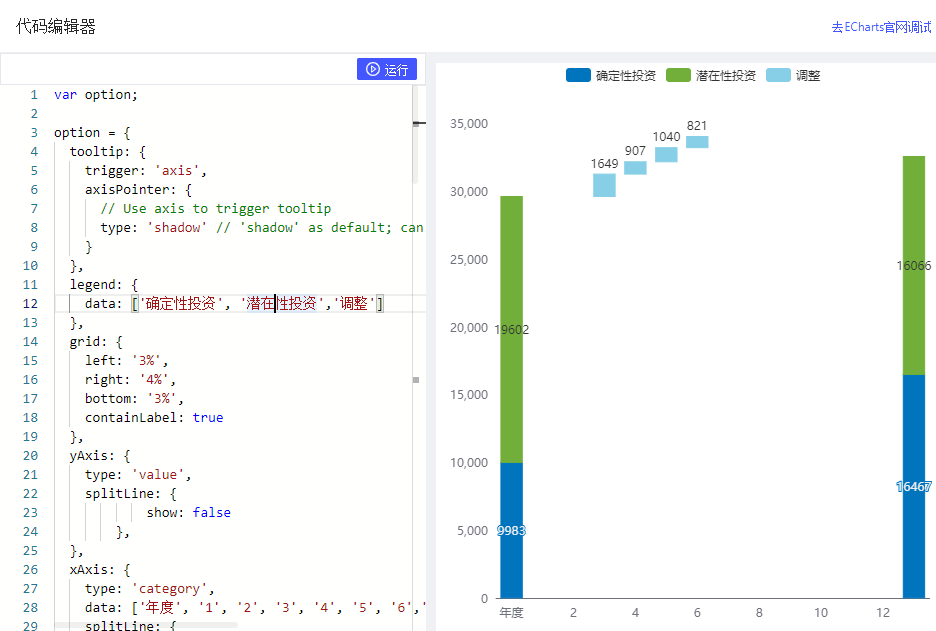
点击「代码编辑器」,输入代码:
option = {
  tooltip: {
    trigger: 'axis',
    axisPointer: {
      // Use axis to trigger tooltip
      type: 'shadow' // 'shadow' as default; can also be 'line' or 'shadow'
    }
  },
  legend: {
    data: ['确定性投资', '潜在性投资','调整']
  },
  grid: {
    left: '3%',
    right: '4%',
    bottom: '3%',
    containLabel: true
  },
  yAxis: {
    type: 'value',
    splitLine: {
            show: false
        },
  },
  xAxis: {
    type: 'category',
    data: ['年度', '1', '2', '3', '4', '5', '6','7','8','9','10','11','12','合计'],
    splitLine: {
            show: false
        },
// 坐标轴刻度
    axisTick: {
      show: false,
    },
  },
  series: [
    {
      name: '占位',
      type: 'bar',
      stack: 'total',
      itemStyle: {
                normal: {
                    barBorderColor: 'rgba(0,0,0,0)',
                    color: 'rgba(0,0,0,0)'
                },
                emphasis: {
                    barBorderColor: 'rgba(0,0,0,0)',
                    color: 'rgba(0,0,0,0)'
                }
            },
      label: {
        show: false
      },
      emphasis: {
        focus: 'series',
        itemStyle:{
            barBorderColor:"rgba(0,0,0,0)",
        }
      },
      data: [0,29585,29585,29585,31234,32141,33181,34002,34002,34002,34002,34002,34002,0]
    },
    {
      name: '确定性投资',
      type: 'bar',
      stack: 'total',
      itemStyle: {
                normal: {
                    barBorderColor: '#0075be',
                    color: '#0075be'
                },
                emphasis: {
                    barBorderColor: '#0075be',
                    color: '#0075be'
                }
            },
      label: {
        show: true
      },
      emphasis: {
        focus: 'series'
      },
      data: [9983,,,,,,,,,,,,,16467]
    },
    {
      name: '潜在性投资',
      type: 'bar',
      stack: 'total',
      label: {
        show: true
      },
      itemStyle: {
                normal: {
                    barBorderColor: '#71af3a',
                    color: '#71af3a'
                },
                emphasis: {
                    barBorderColor: '#71af3a',
                    color: '#71af3a'
                }
            },
      emphasis: {
        focus: 'series'
      },
      data: [19602,,,,,,,,,,,,,16066]
    },
    {
      name: '调整',
      type: 'bar',
      stack: 'total',
      label: {
        show: true,
        position: 'top'
      },
      itemStyle: {
                normal: {
                    barBorderColor: '#87cfe6',
                    color: '#87cfe6'
                },
                emphasis: {
                    barBorderColor: '#87cfe6',
                    color: '#87cfe6'
                }
            },
      emphasis: {
        focus: 'series'
      },
      data: [,,,1649,907,1040,821,,,,,,,]
    }
  ]
};
效果如下图所示编辑


