Overview编辑
Application Scenario
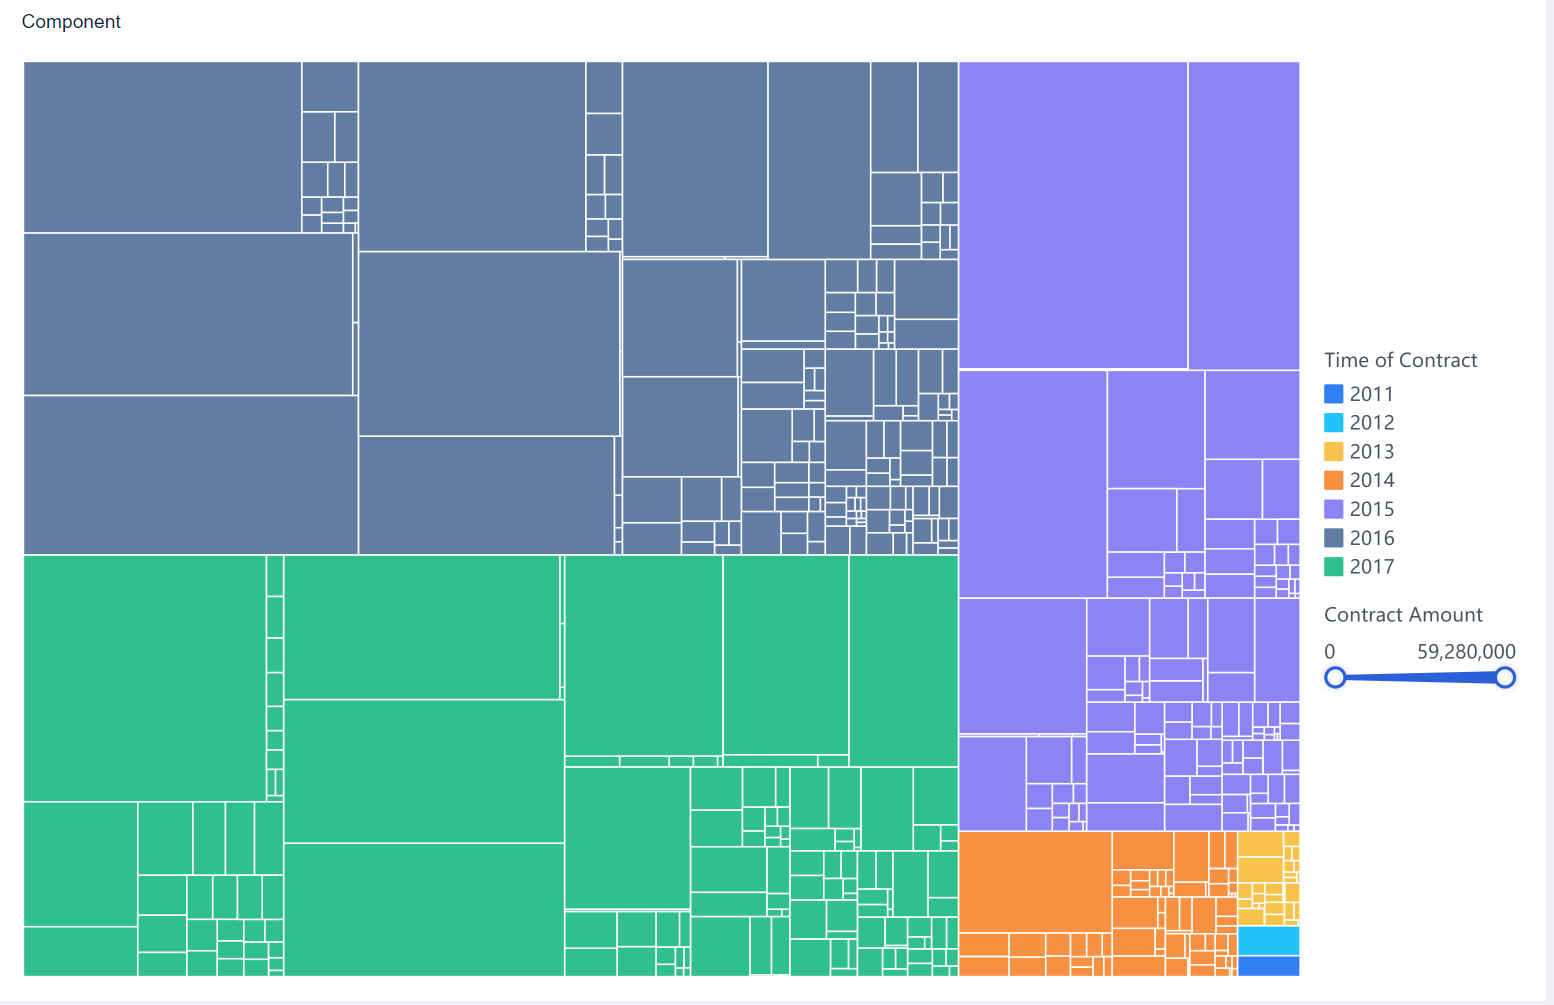
Rectangular tree charts are used to illustrate the proportion relationship of data with hierarchical structures and can display the lower-level data through hierarchical drilling.
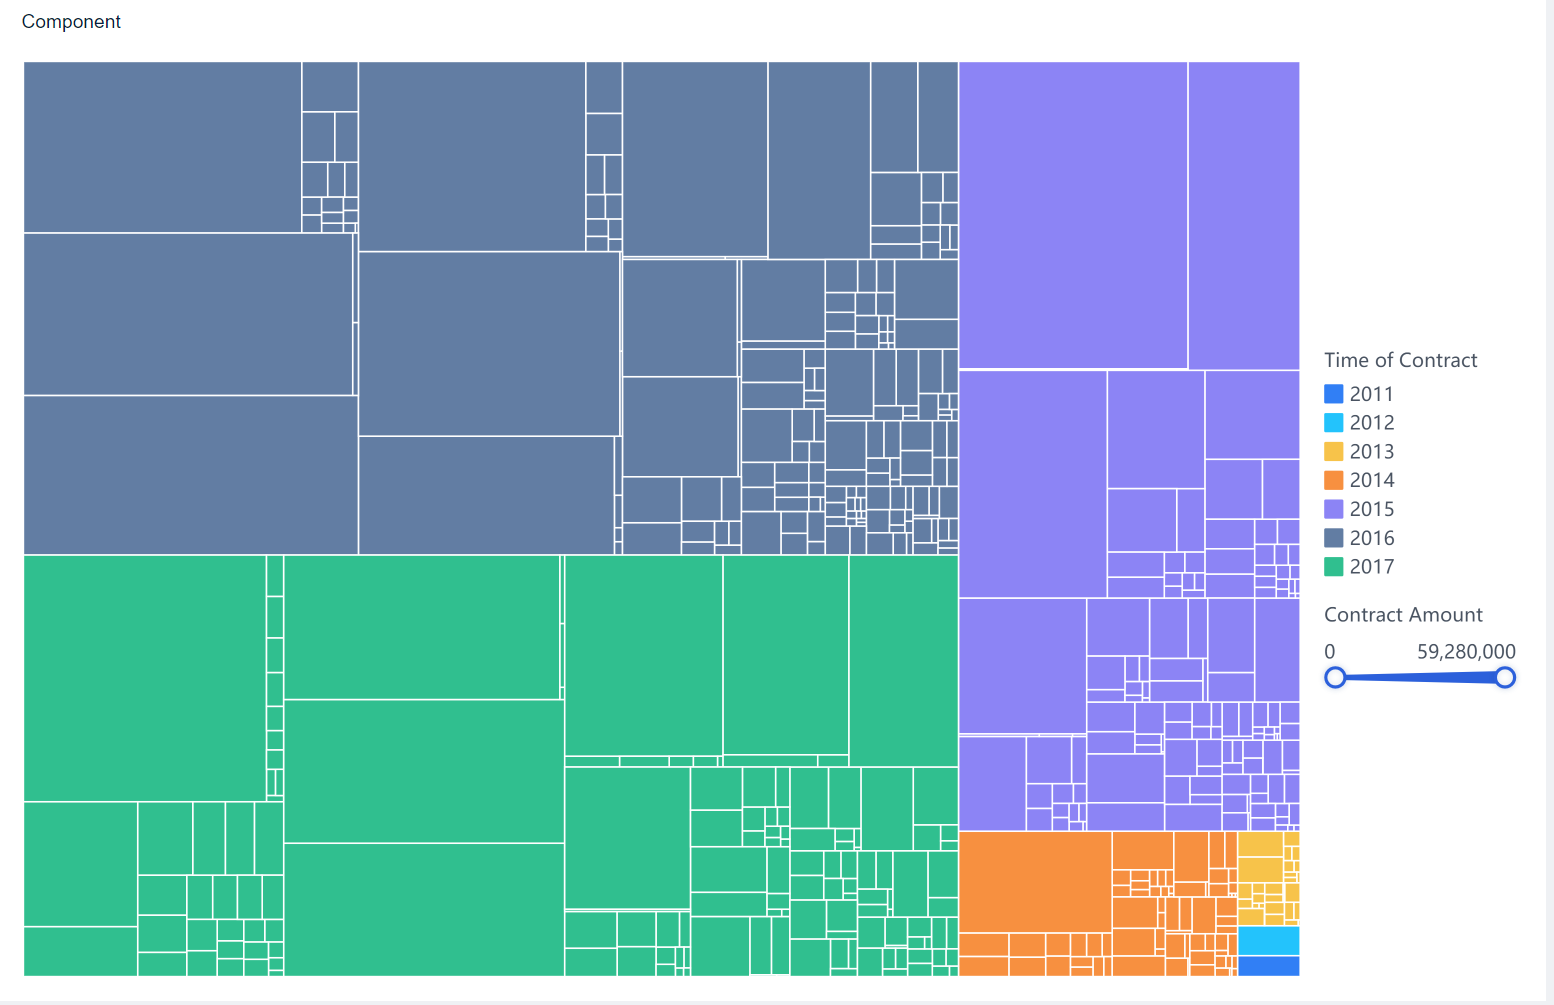
For example, you can use rectangular tree charts to display the contract amount. The same color represents a year and each square of the same color represents a category of products. Rectangular tree charts can help you clearly view the contract amount of a year and a product type through the size of rectangular blocks. The effect preview is as follows.
Basic Requirement
Basic requirements for rectangular tree charts are as follows.
| Chart Effect | Dimension Field | Indicator Field |
|---|---|---|
| 矩形树图 | >=1 | 1 |
Chart Feature
Advantage: Rectangular tree charts can display data with hierarchical relationships and comparisons between the same levels.
Disadvantage: Rectangular tree charts are not suitable for data with unclear hierarchical relationships or a large number of categories.
Example编辑
Data Preparation
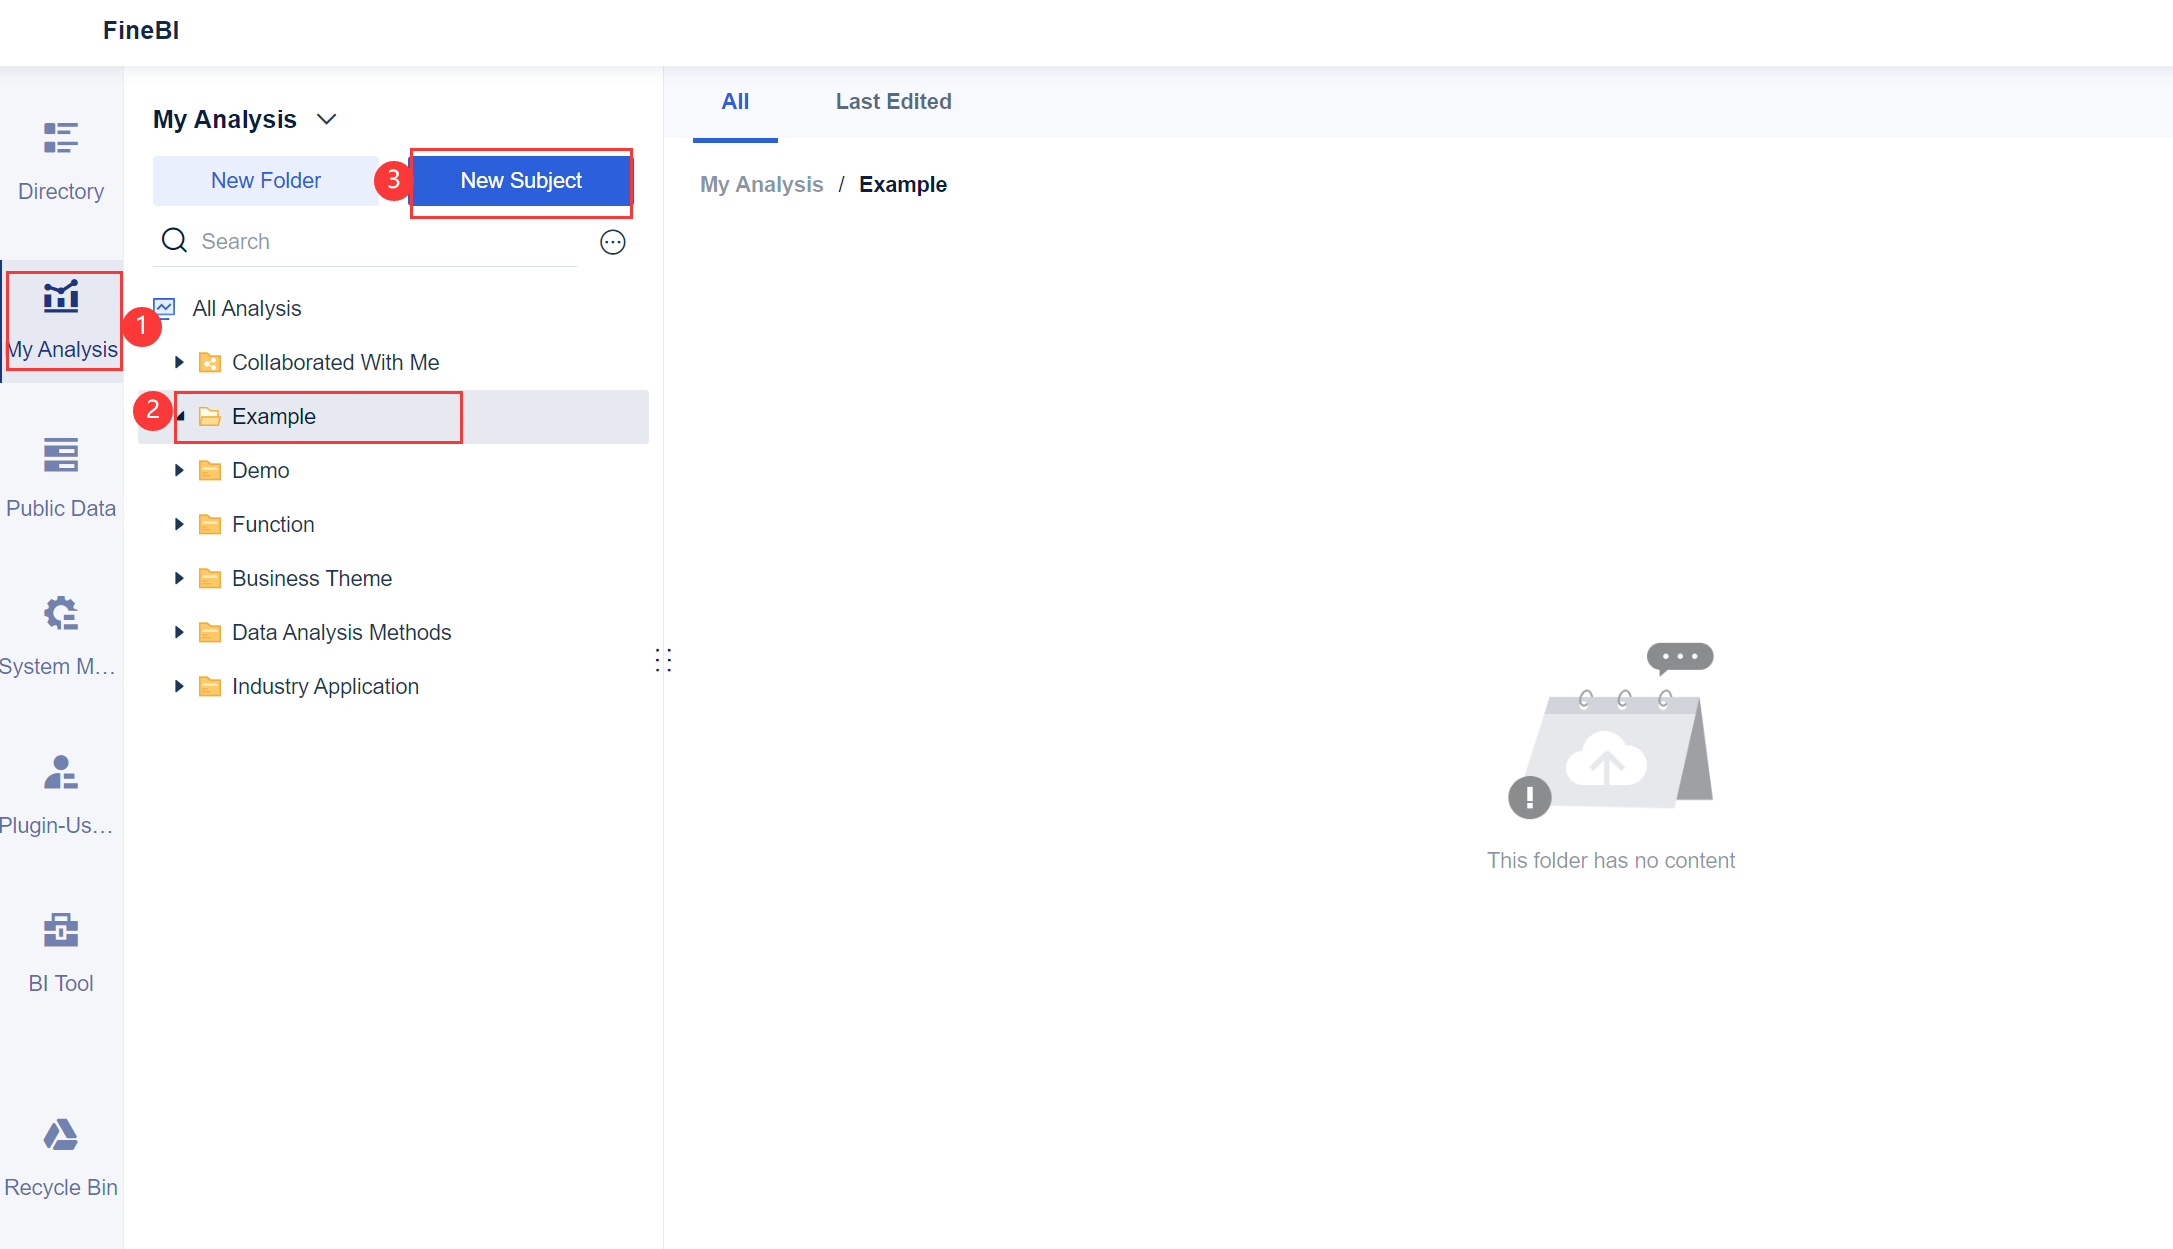
1. Log in to the system as the admin, click My Analysis, select a folder, and click New Subject, as shown in the following figure.
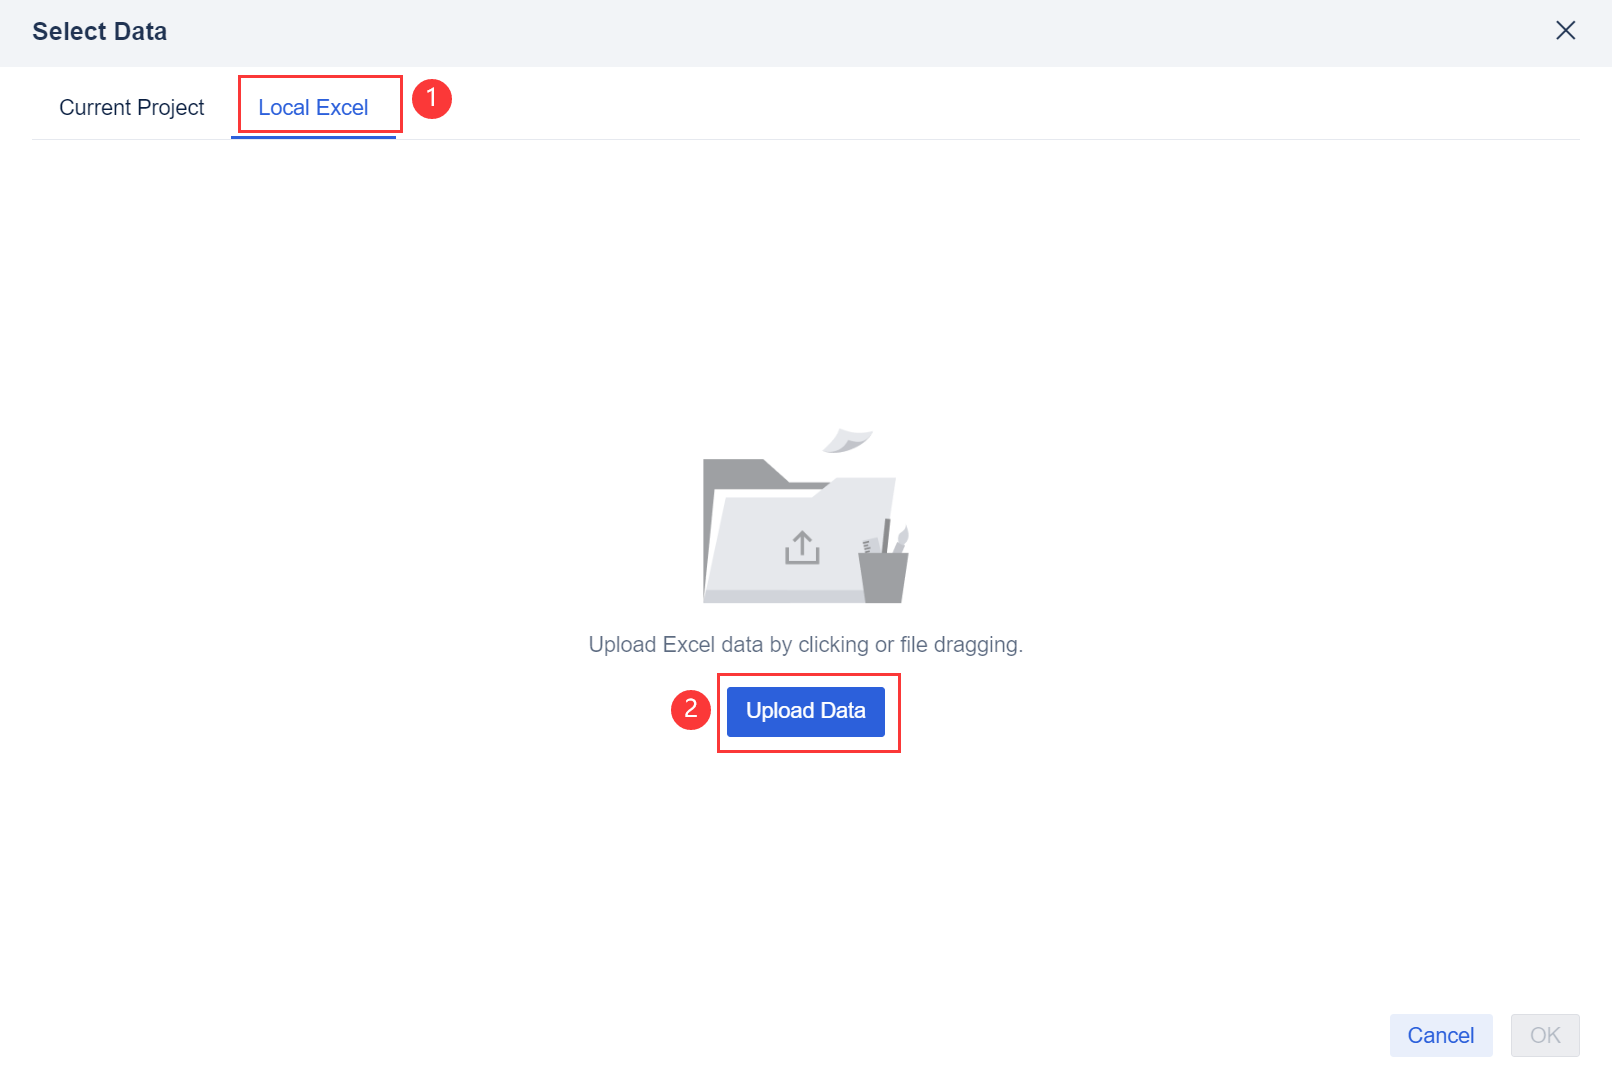
2. Click Local Excel and click Upload Data, as shown in the following figure.
You can download the example data.Regional Data Analysis.xlsx
3. After the data is uploaded, click OK.
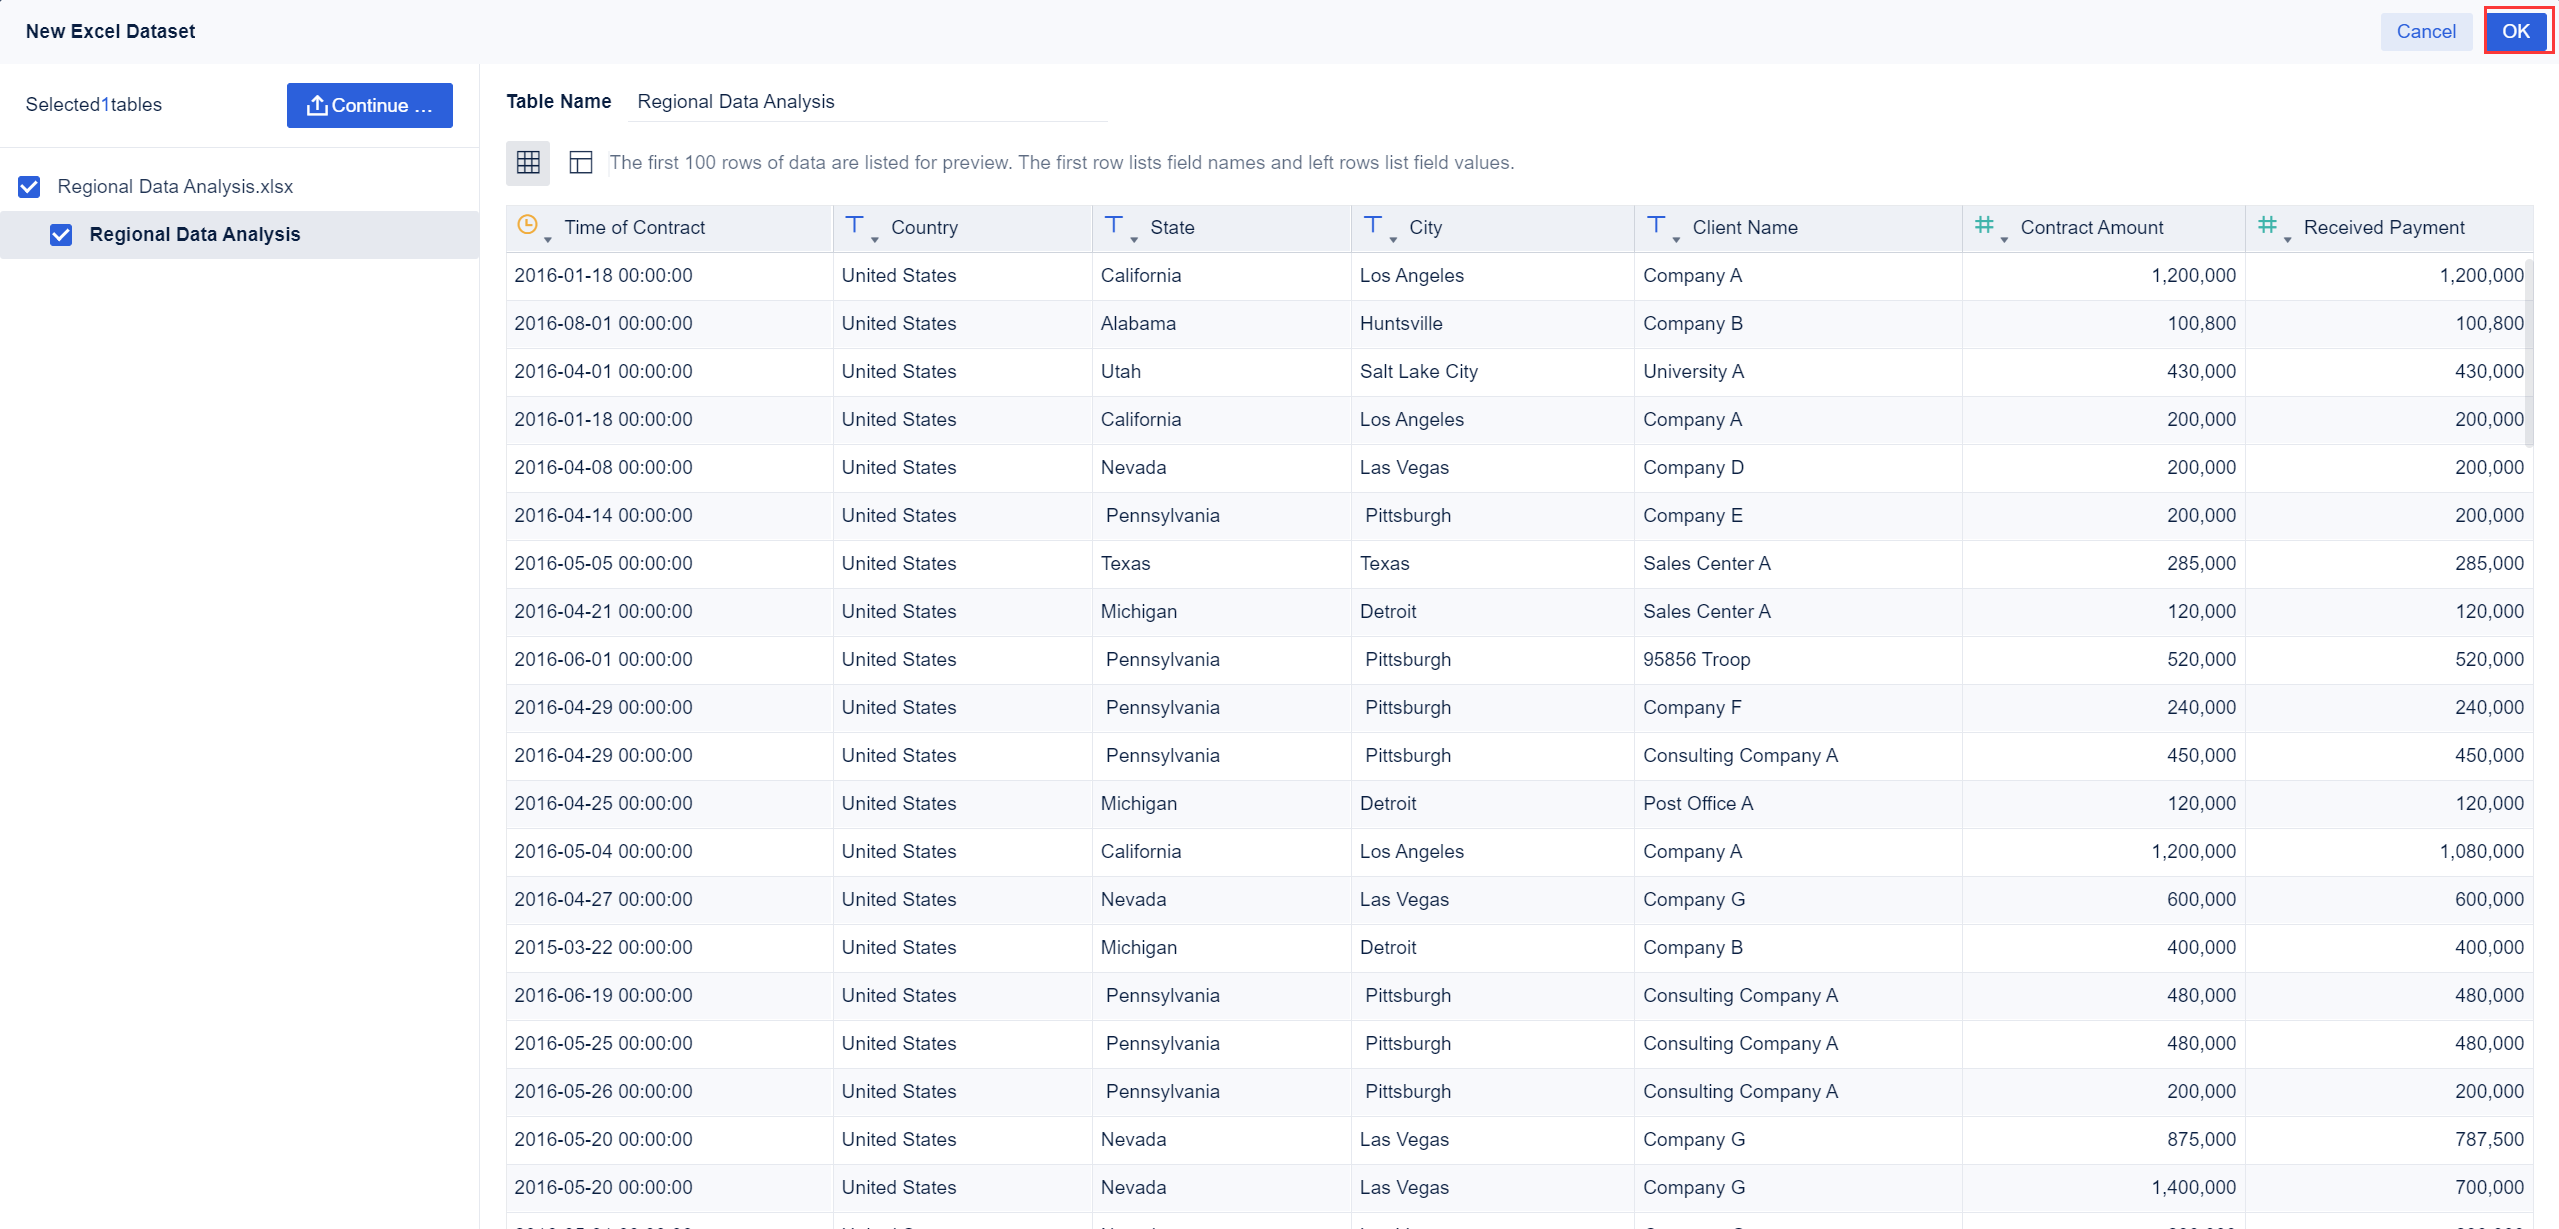
Component Creation
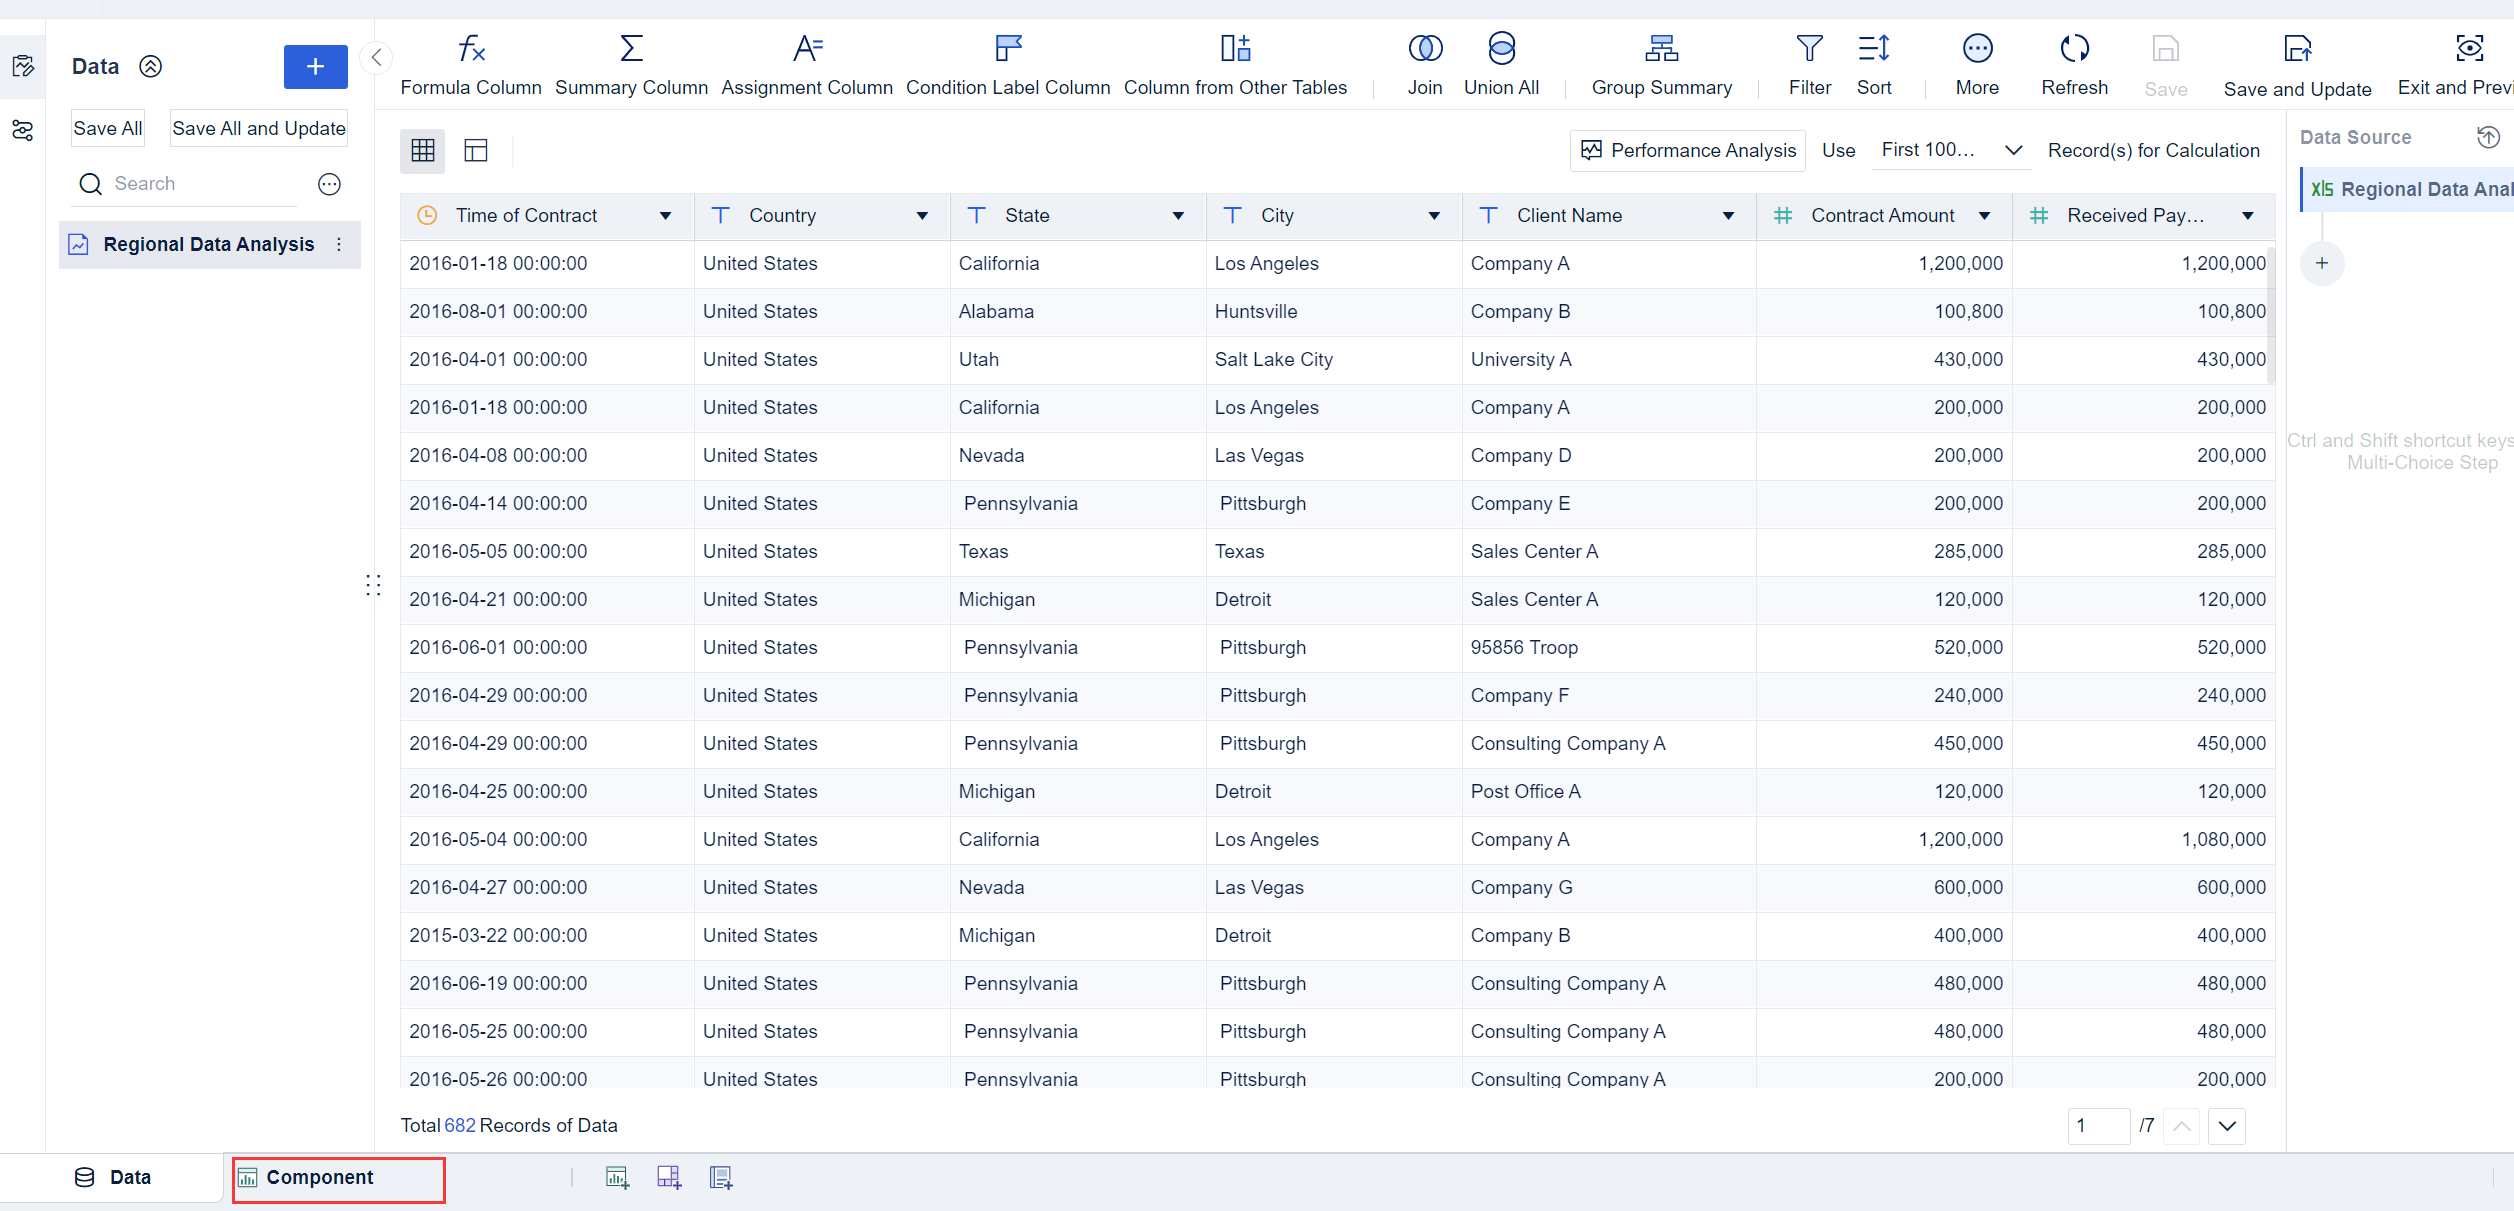
1. Click Component in the lower left corner.
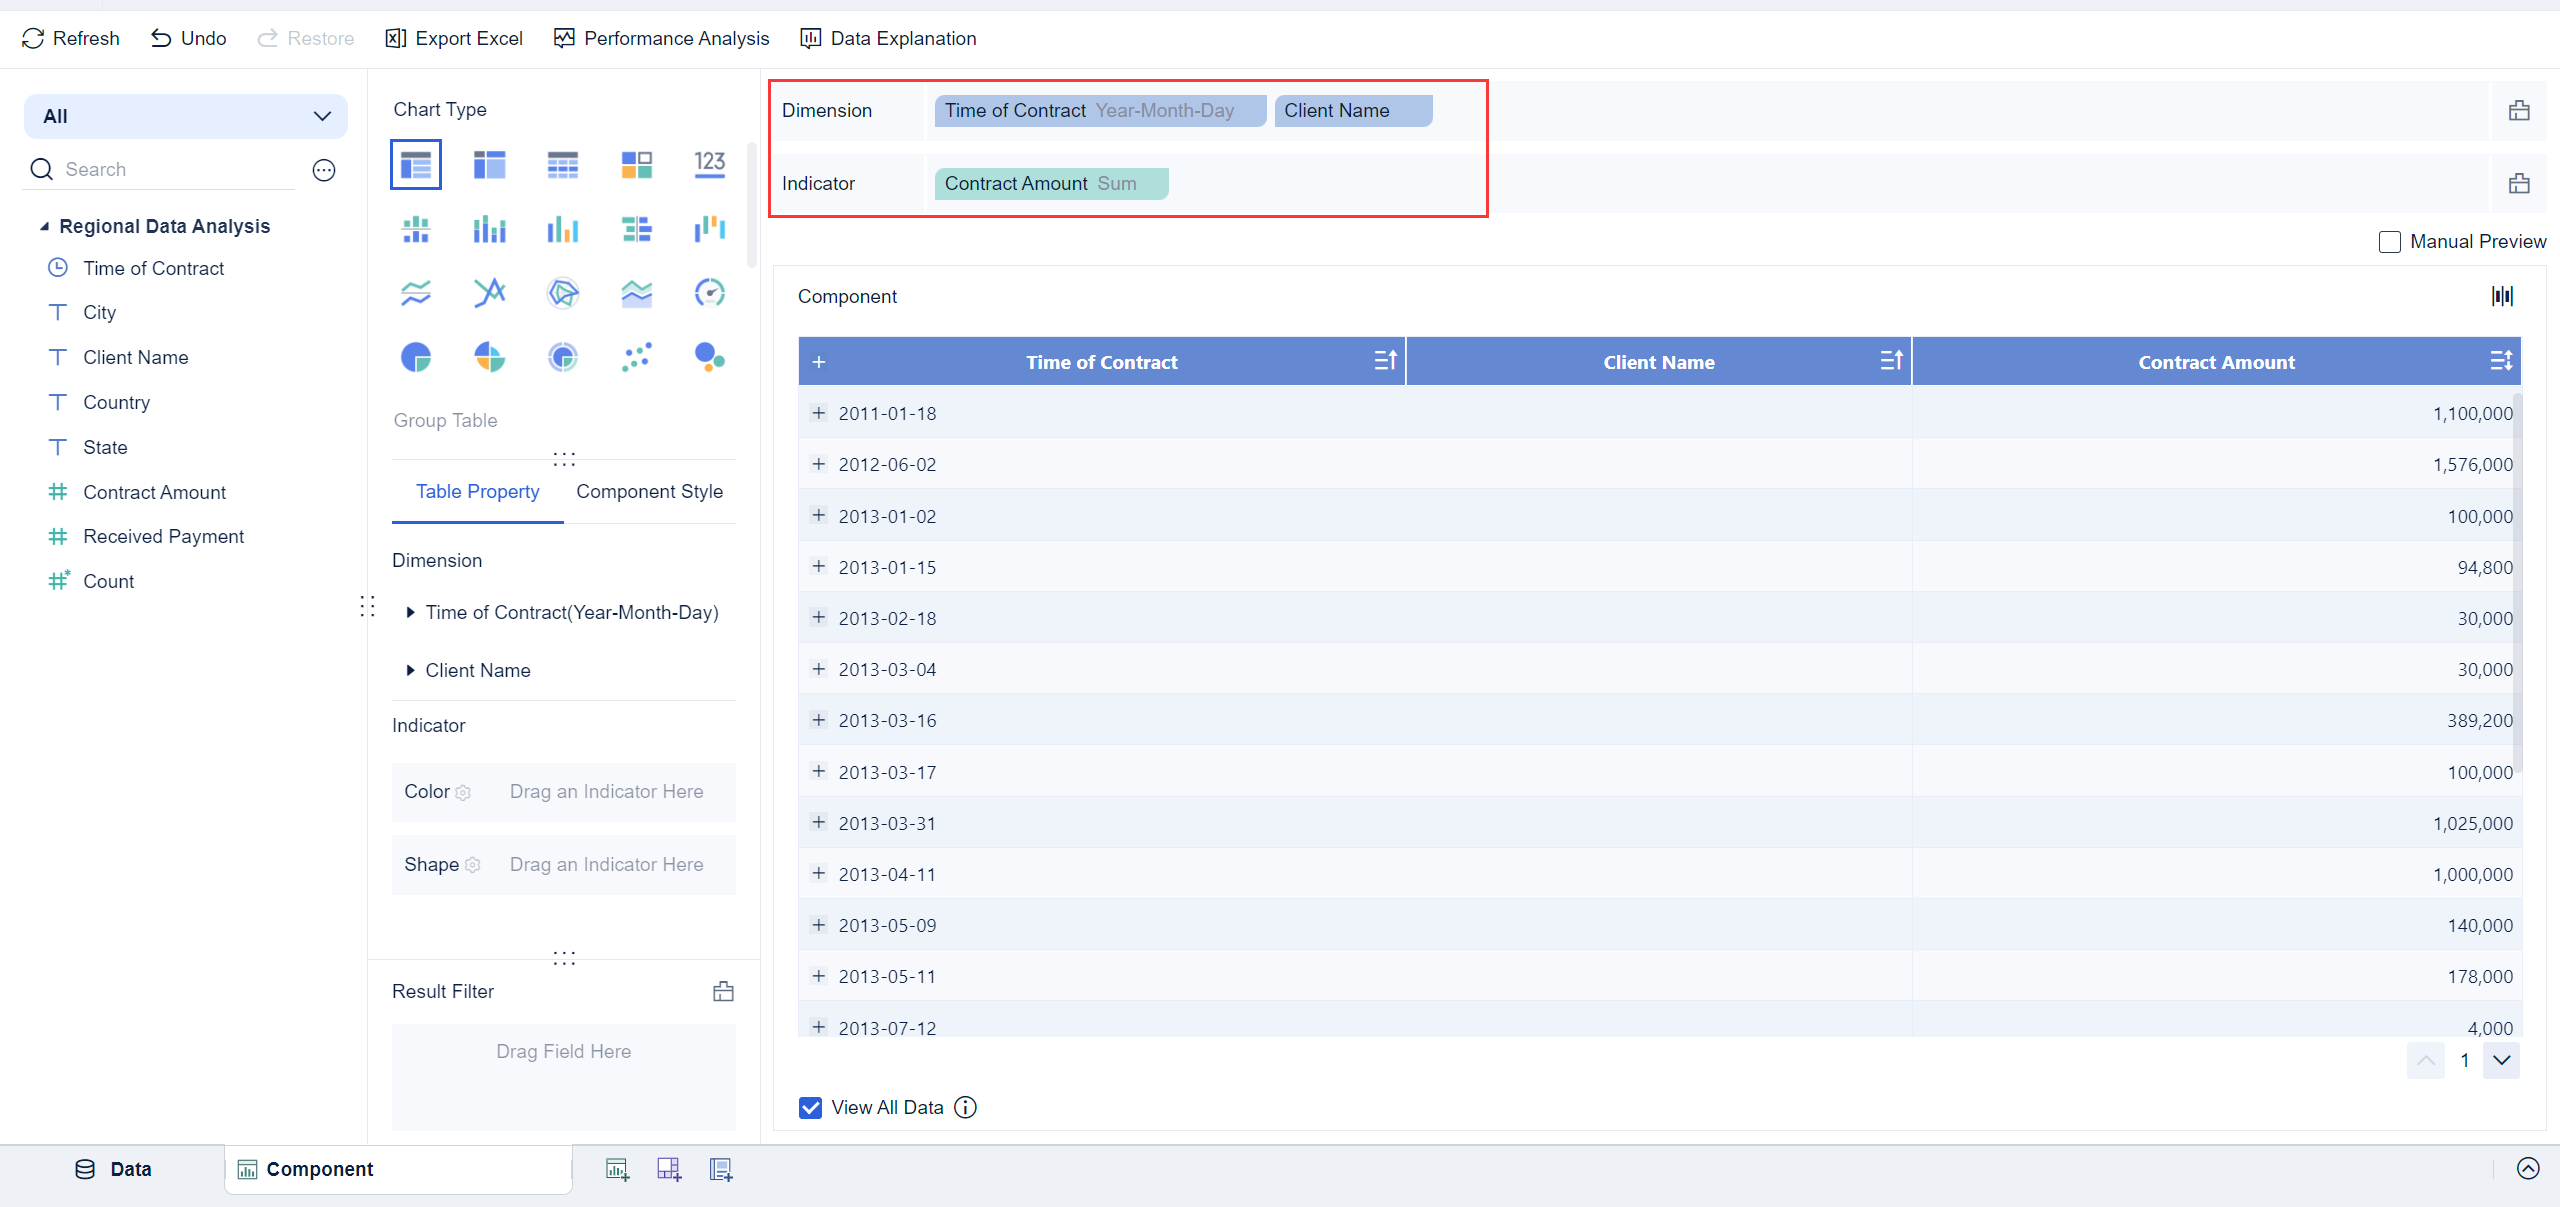
2. Drag the Time of Contract and Client Name fields into the Dimension bar, and the Contract Amount field into the Indicator bar.
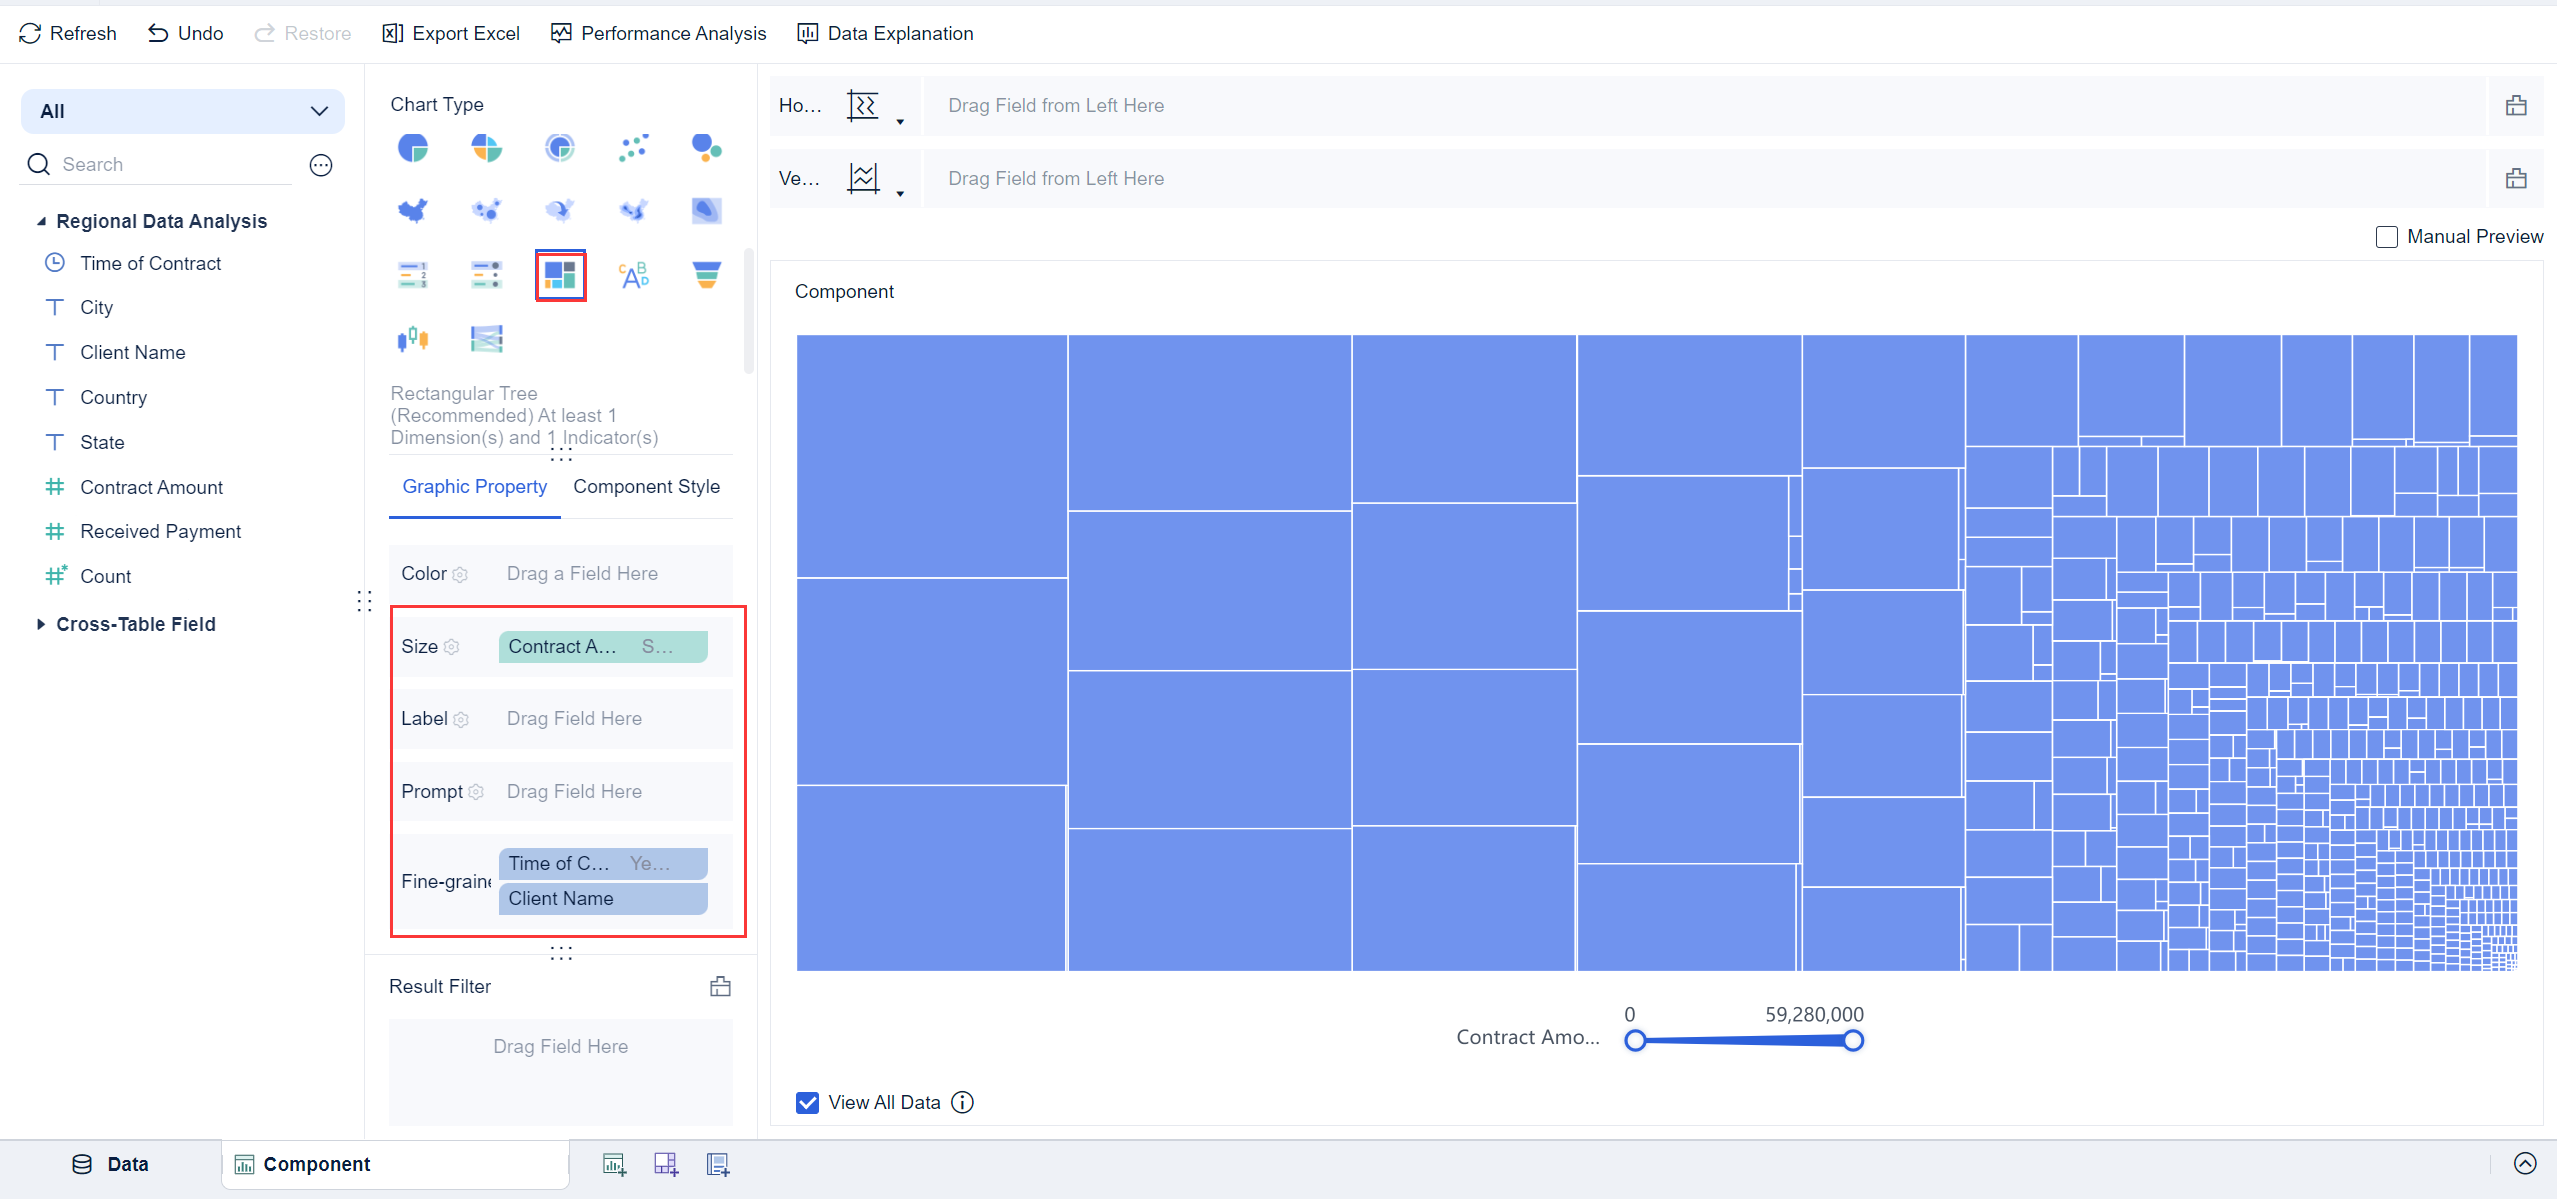
3. Click the Rectangular Tree Chart icon in Chart Type. The dimension fields are added to the Fine-grained bar in order and the indicator fields are added to the Size bar.
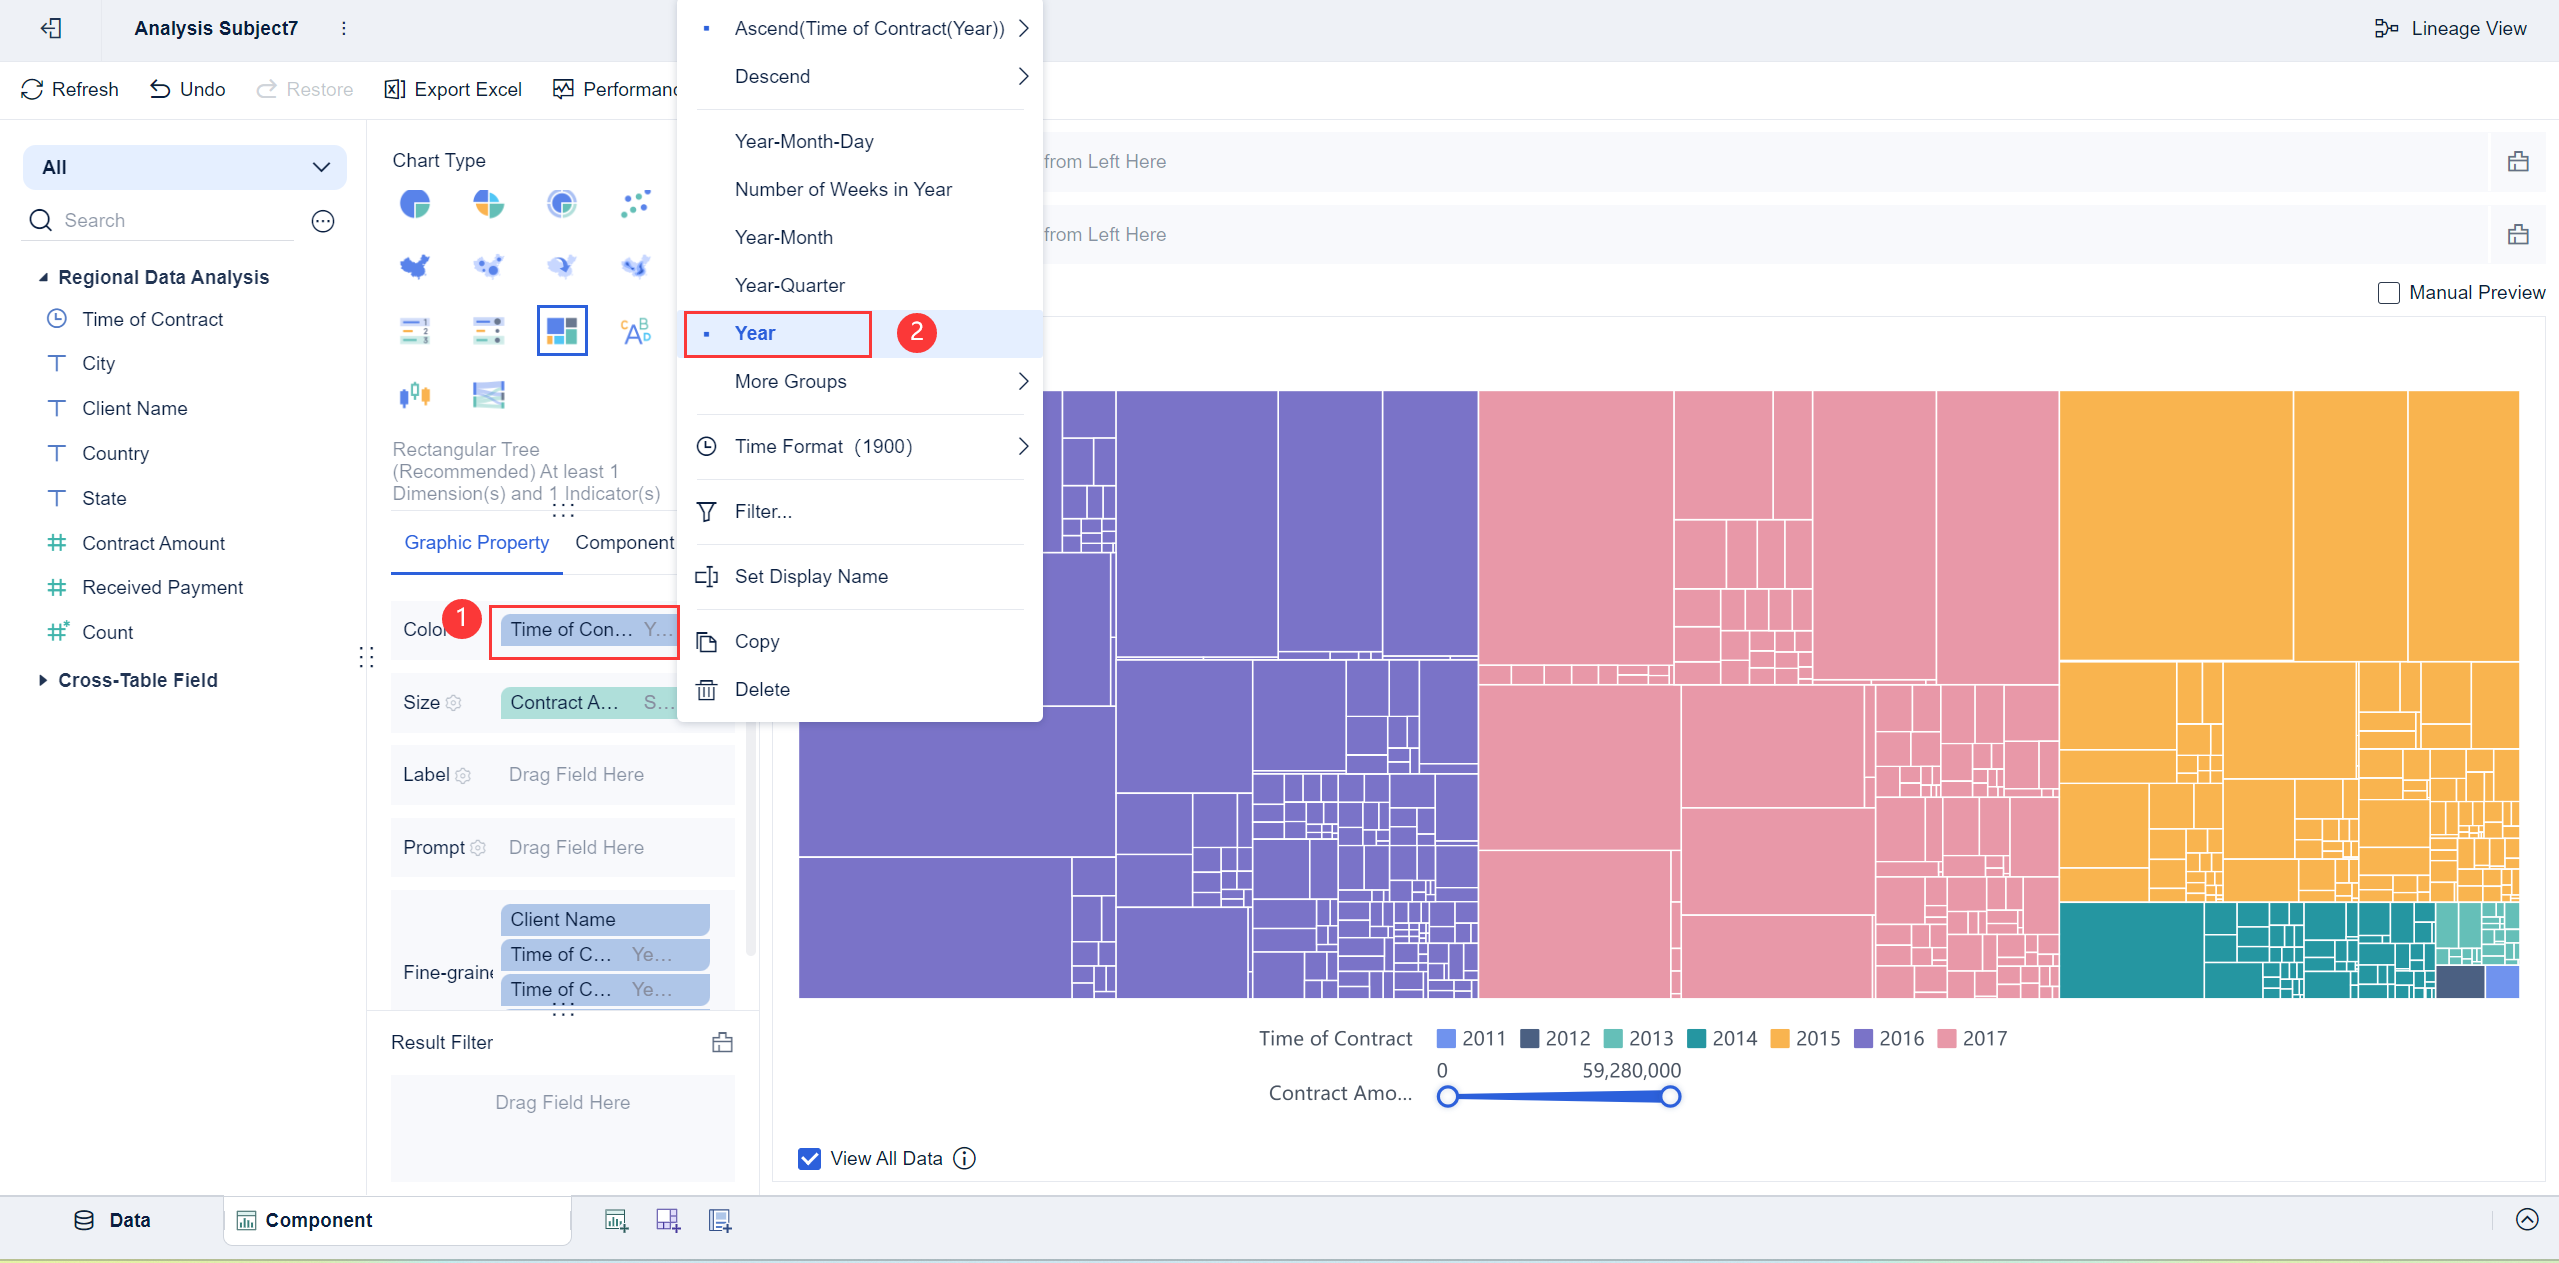
4. Drag the Time of Contract field to the Color bar, click the icon xxx and select Year from the drop-down list, as shown in the following figure.
 Note:
Note:
Graphic Property Setting
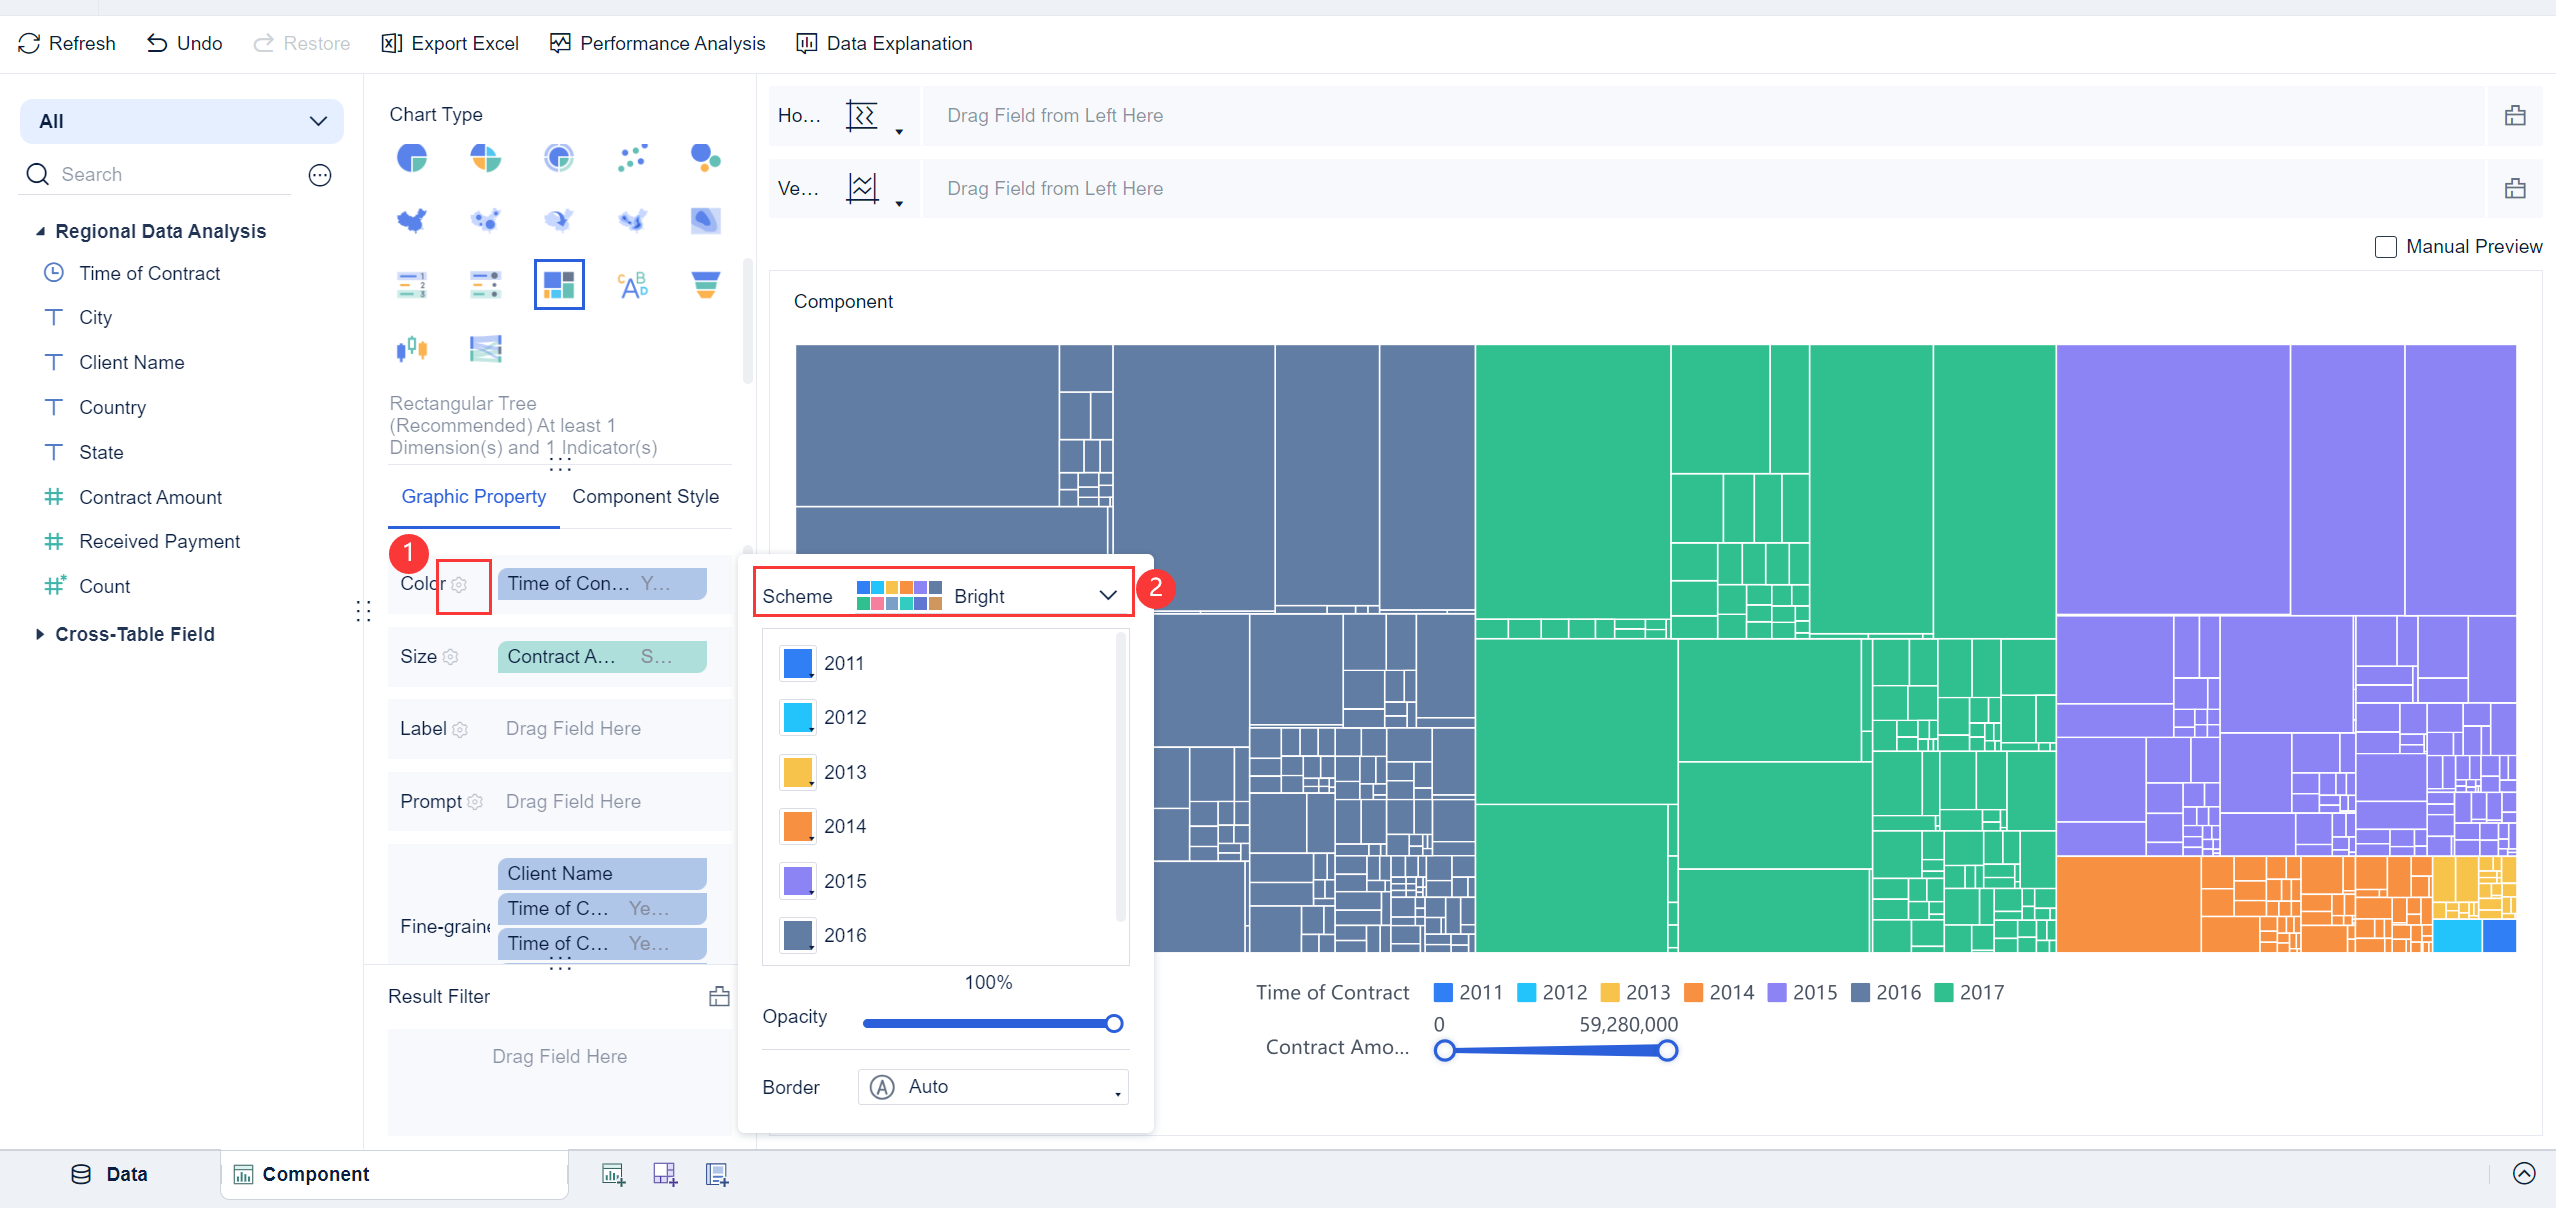
Click the icon ![]() and set the Scheme to Bright, as shown in the following figure.
and set the Scheme to Bright, as shown in the following figure.
You can set the parameters of Size, Label, Prompt, and Fine-grained. For details, see Graphic Properties.
You can also set the parameters of Legend, Grid Line, Background, Adaptation Display, and so on for the component. For details, see Chart Component Style.
Effect Display
You can view the effect on both mobile terminals and the PC.
The effect preview is as follows.
